

Don't be a Data Hoarder
Don't be a Data Hoarder
If you are hoarding data instead of acting on your data, you are missing opportunities.


As Christmas passes into the new year, the decorations go back into boxes, and those boxes head back to the basement, the attic, the spare room, or wherever the stuff you don’t need for another year goes….. you may be wondering where I am going with this but hang with me for a moment.
Many organizations do this same thing with their utility data. Sure, they get the invoice, and they process the payment, but are you looking at the actual consumption of energy and water every month? Are you comparing it against other like buildings? Are you watching for trends of usage increasing or decreasing? Unfortunately, in many portfolios, data comes closer to resembling the AMC show hoarders, being stored, sitting in a file cabinet, or on a server. If it is pulled out at all, it is likely only for regulatory compliance or an annual budget exercise, perhaps for GRESB reporting or other ESG report. Rarely is it being leveraged regularly to contribute towards a continual improvement process.
The 2019 NAA Survey of Operating Income & Expenses in Rental Apartment Communities shows us where those operating expenses are, and utilities consistently account for 6% of the total operating expenses per unit for both garden and mid/hi-rise apartments. While there are other higher-ranking expenses, most are not controllable expenses. I find it more interesting that repair and maintenance make up the same level of expense (6%) in mid/hi-rise and only slightly more for garden apartments, yet how closely we monitor those costs while paying such little attention to the utility costs. We are bidding paint, reviewing monthly supply invoices, actively manage maintenance-related expenses, yet the same amount of money being spent on utilities is literally spinning a meter wheel with little thought.
Part of this is scale and complexity; there could be hundreds of meters, sub-meters, account splits, vacancies, and other complications with utilities. It becomes more useful when the data can be rolled up into a common area total cost and consumption, in addition to total property cost and consumption. Now you have information that you can use to make decisions. Interestingly, in much of the United States, that data can be collected relatively easily.
Let’s imagine for a moment if you could roll that data up to the property level and even better to the portfolio level. If you manage others' assets, it could even be rolled up at the asset owner level. Now you can evaluate where you should be looking, where you should be taking action. You have a roadmap.
Honestly, we sometimes make a habit out of this behavior in building operations. Consider the Building Automation System, the points it is monitoring. Even with automation, are all of those points being leveraged for decision-making? Ideally, yes, every single point we are monitoring is feeding our decision-making process. But if you have been in this industry for any amount of time, chances are you have seen dozens, perhaps hundreds of data points being ignored - at least until a problem surfaces.
Realizing that gathering actionable data is important, the next goal would be to understand what is normal. What should my property be consuming? The United States EPA and Department of Energy created the Energy Star Portfolio Manager Program for this very purpose. Energy Star provides a resource to compare your data against. It is not perfect, we will discuss this in just a moment, but there is some data to compare against and benchmark or compare your performance of energy, water, and even waste. Where Energy Star Portfolio Manager does shine is it is almost universally the required platform for jurisdictions with benchmarking regulations. The bottom line is Energy Star Portfolio Manager is a nice tool; as long as you understand its limitations. But it is but one tool and works best when combined with additional energy analysis tools.
Let us build on that for a moment. Assuming you are using Energy Star Portfolio Manager, what might be some additional features that could provide you greater insight, control, and management of your consumption.
Let’s go back and dive deeper into what is normal. What are you comparing your property against? Is that data up to date? Is it market-relevant? How many buildings are in the data set you are using?
In 2018, the EPA updated the performance metrics used for industrial and commercial buildings in their benchmarking tool. An important step to keep the metrics current with market performance. Unfortunately, this update was not universal across all building types, and multi-family properties were not included in that update. Multifamily properties use a different database, which makes sense as comparing an apartment building against an office building would likely not provide you much insight. The database used for multifamily benchmarking is quite dated; as mentioned in the article last week, it is from a 2011 Fannie Mae report Multifamily Energy and Water Market Research Survey. The dataset itself is also quite limited. With only 672 properties in the data set that provided both energy and water data, an additional 278 provided energy only, and 64 provided water data only. I have great respect for what Energy Star Portfolio Manager provides, but this is a fairly limited data set that we are using to benchmark against, and it is old, a decade out of date. Think about how much technology has changed in the last 10 years. When you consider this, you start to see the limitations of relying on such a limited dataset. Fortunately, there are larger datasets available with more contemporary data. However, they are typically privately held, which means to access the more market-relevant data, you have to engage with a provider who has such a database. For comparison's sake, the Bright Power data set used for benchmarking contains over 96,000 properties, quite a contrast to Energy Star’s not quite 1,000 who provided energy data. That can be quite a differentiator, the difference between just doing and demonstrating a genuine commitment to looking for and acting on the most effective efficiency opportunities.
Peeling Energy Star Portfolio Manager a bit more, it is also important to realize it is a DYI platform. The user inputs the data (or it is arranged to be input by the user), and the results have to be interpreted by the user. Energy Star will not proactively alert you if a property has begun an increasing consumption trendline. It lacks the ability to provide the user action-ready and property-specific insights and recommendations from energy analysts or engineers to decrease property and portfolio level utility costs and consumption. Positive and negative impacts have to be identified by the end-user. These attributes mean the data received requires additional analysis and interpretation by the end-user to be actionable. In a larger portfolio, scale complicates this ability as most of us lack the internal staff and resources to sort through the data and identify meaningful trends.
Finally, Energy Star Portfolio Manager requires whole building data and doesn’t distinguish between owner-paid and tenant-paid expenses. This one is tricky as we want to reduce the overall impact of the property. It benefits both owners and tenants to reduce consumption, to identify and eliminate waste. But we also have budgets, and returns on investment that have to be managed, depending on whose cost is impacted can impact the decision-making process.
So let’s build a model on how we can improve on the use of that data. Would it benefit you if each property received a report advising them how they are doing? Like a report card in school, showing if their consumption is increasing or decreasing? What steps might they take to reduce that consumption? Perhaps a portfolio-level manager notification if the variance exceeds a particular threshold. While we are at it, back to that scale issue, perhaps an energy analyst to crunch the data, comparing it against other, more robust datasets, and really provide insight into what those numbers mean.
Maybe something like this:
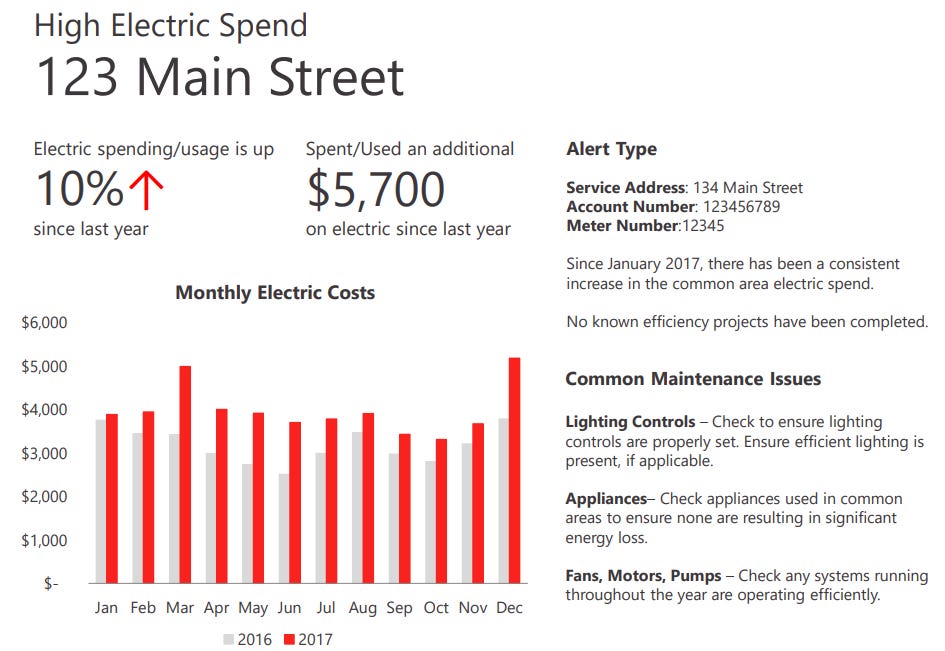
When combined with a portfolio review, where your opportunities can be discussed with an Account Manager, someone who can point out where the biggest bang for the buck likely is and help develop an action plan to capture that opportunity. Suddenly we have a model of your utility consumption that allows that data to work for you, and you can take action from it. It is no longer sitting in storage for that once-a-year review; it is actively being managed. The larger the portfolio, the more important this becomes.
On average, study after study shows that 30% of all energy used in commercial buildings is wasted because of inefficiencies. One article from Smarter Buildings at IBM pronounced that “as much as 50% of the energy and water that flows into our buildings is thrown away.”
When you begin to pay attention to the data, many opportunities surface in addition to utility costs. Obviously, the property's environmental impact is reduced, which is the mission of this blog. Interestingly, the insights into utility consumption can also lead to maintenance improvements and even extend the asset's lifespan. When we identify inefficiencies, we are typically looking at the building's mechanical, electrical, and plumbing systems. The more proactive we can be in addressing these areas, the more likely we can catch issues and correct them before they become failures. Fewer failures can lead to fewer tenant complaints, leading to more satisfied residents, which can lead to increased renewals and reduced turnover.
Other industries have leaned on continual improvement processes for decades. They go by names like Total Quality Management, Six Sigma, and several other names depending on the latest in vogue author. But they all share the goal of elimination of errors, as errors are considered waste. For a significant amount of time, our cousins in the industrial sector have long realized that the identification and elimination of waste drive profit. Yet somehow, in Real Estate generally and Multi-Family Real Estate, in particular, we have tolerated the presence of waste in our utility process. Perhaps it seemed overly complicated, complex, and time-consuming, but these processes don’t have to be your portfolio's core practices. There exist specialized companies such as Conservice who can help run this exact model with you in your portfolio. Identifying waste, addressing it, and making sure it really is corrected. It can be said that the simple process is to, Find - Fix - Follow.
Regardless of what strategy you use, your data must be guiding you towards actions.
You can help reduce the impact of the built environment by sharing this blog with your peers. Together we can impact the 39% of greenhouse gasses attributed to the built environment. It starts with awareness, and we succeed with teamwork.
SStay well!

Chris Laughman is the ThirtyNine Blog author, a blog dedicated to reducing the impact of the built environment. When not blogging, Chris is helping the real estate industry reduce energy and water impact as the Vice President of Sustainability for Conservice, the Utility Experts. Whether Multifamily, Single Family, Student Housing, Commercial, or Military, we simplify utility billing and expense management by doing it for you. Our insight into your utility consumption provides an opportunity to identify risks. Leveraging innovation and experience we ignite solutions with real impacts and track performance to ensure the trendline stays laser-focused on the goal. At Conservice we have developed a true bill-to-boardroom solution to help truly make a difference. We have before us a tremendous opportunity. Standing shoulder to shoulder, we will get this done. Contact me at claughman@conservice.com for more information.
Follow us at:
Twitter: @BlogThirtynine

Instragram: ThirtyNine_Blog
