


Finding the Needle in the Haystack
A preview of our Apartmentalize Panel, which you can participate in on Thursday, September 2 @ 10 am Central if attending. Hope to see you there!


Whether you have a portfolio of 10 or 1000 properties, scale is real, especially in multi-family real estate. There are literally mountains of data points, especially when you have tenant-metered properties. We have essentially assembled a giant haystack, and the opportunity to reduce expenses is a needle somewhere buried in that haystack. The larger the portfolio, the larger the haystack.
Any decision we make requires inputs and evaluation of those inputs. Even when we aren’t thinking about it; our brain is collecting data and leading us towards decisions. Think about crossing a street. We approach the street; our mind tells us to stop before we step in the street. Hopefully, we are looking both ways; we are also likely taking in the behavior of other pedestrians if present, the weather, and many other attributes we may not even realize. Each of these observations is a data point that we then use for deciding that it is now safe to cross the street.
In real estate, those decisions typically contain a high level of complexity, so this intuition approach we used to cross the street might require a more deliberate data-driven decision-making process.

That more deliberate process begins with understanding the context of the issue we are trying to solve. What is the context, prioritization, and any cause-and-effect connections? Perhaps we are concerned about documenting and reducing the carbon emissions of our organization.
Knowing now what we are trying to solve and why we are trying to solve it, we have to figure out where the data is going to come from. This is perhaps one of the biggest challenges for multi-family real estate. While there has been recent progress in green button expansion and deployment of smart meters across many utility portfolios, pulling aggregate whole-building data remains a challenge.
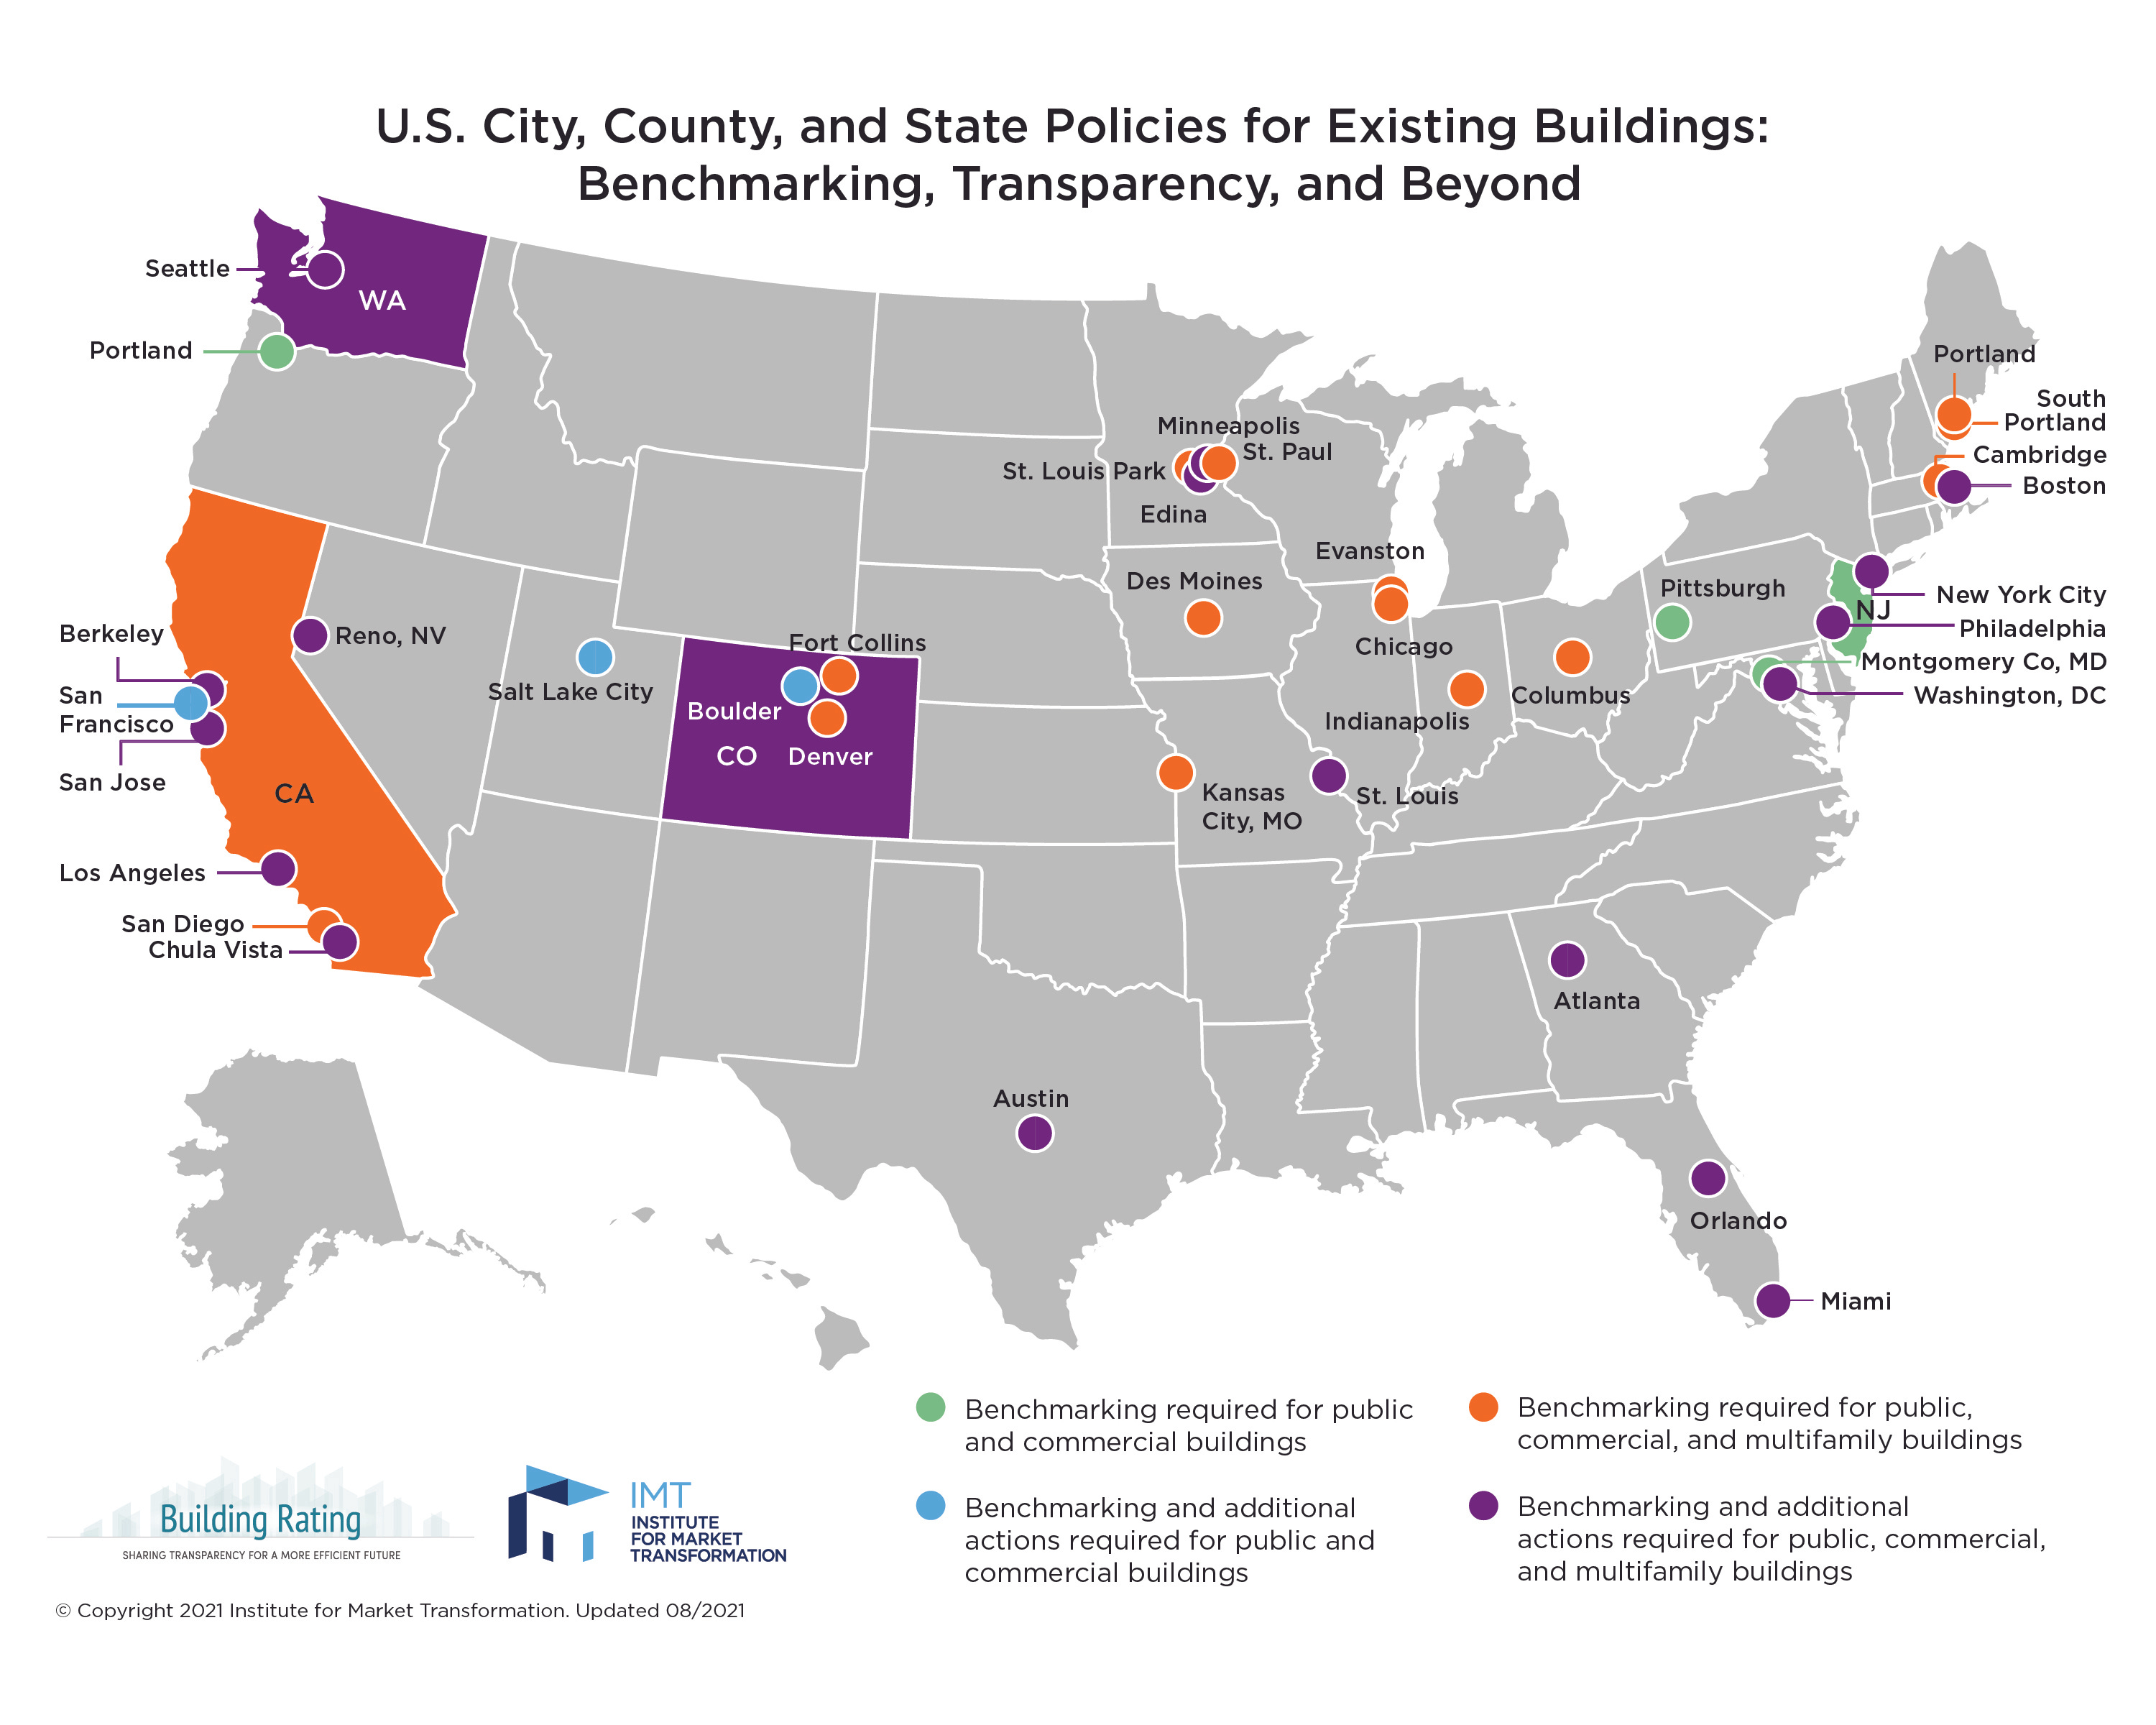
One thing that has helped in that collection process is the increase in benchmarking reporting regulations. Jurisdictions like the recently passed statewide Colorado requirement compel utilities to provide whole-building data, although not always as often as we would prefer. Understanding where these requirements exist and having a plan for compliance is as important as knowing where the data can be obtained.
Once that data is collected, the next step is benchmarking that data. Essentially figuring out what is normal and how your property stacks up. The size of the database, as well as the more contemporary the data, is in the database, can be a differentiator here. The more robust and contemporary the data being used for comparison, the more exact your results are. It is almost the same as cutting a tomato with a butter knife and then cutting one with a newly sharpened knife. The sharper the edge - the better the cut.
Determining tangible, specific, and relevant KPIs is the next step in this more formal process. KPI’s can be a pain point; some like them, others hate them. Investing the time and effort into finding the right performance indicators is the key to effective KPI’s. The old saying about you can’t manage what you don’t measure; this is the measurement.

Data visualization is a component that is more often done poorly. Too often, dashboards are overly complex or require too much effort or interpretation to be meaningful. Yet, a well-designed dashboard is key to identifying trends and anomalies. The dashboard is the compass that helps you locate where in the haystack that needle is at. But the visualization must be done in a way that is both understandable and contextual enough to make a difference to decision-makers. This is your vehicle to move towards actionable data. However, if you have to explain what the dashboard is saying or need to have an engineering degree to understand it, your dashboard is likely not sending the right message.

Our action plan transitions from consideration of the data to doing something about it at this point. This might mean site audits, energy treasure hunts, or other site-specific actions that lead to taking action on the data.
After the tactical plan is developed and the return on investment is considered is time that we move towards actual intervention. Retrofits and improvements deliver the actual savings that the property expects to experience. We are now swinging hammers and turning screws.

The results from that action then need to be analyzed. Did you experience the ROI you expected. The proof is in the pudding so to speak. We are looking not only at what went right but also at what did not go so well. You are looking for deep learning as to the reasons for success or failure. The better the analysis, the better the next process.

We then loop the process back to step one, reassessing the context and following the same steps applying what we learned along the way. Take note of any principles that were helpful, approaches that need to be approved, and any unnecessary complexity.
Want to dig in a little deeper? If you happen to be attending NAA’s Apartmentalize Conference in Chicago, you can join me for a panel discussion on this very topic. On Thursday, September 2nd at 10:00 am Central; we will be diving into this topic in more detail with an expert panel.

The discussion promises to be insightful and provide key takeaways that you can bring back to your own portfolio. I hope to see you there.

You can help reduce the impact of the built environment by sharing this blog with your peers. Together we can impact the 39% of greenhouse gasses attributed to the built environment. It starts with awareness, and we succeed with teamwork.
Stay well!

Chris Laughman is the ThirtyNine Blog author, a blog dedicated to reducing the impact of the built environment. When not blogging, Chris is helping the real estate industry reduce energy and water impact as the Vice President of Sustainability for Conservice, the Utility Experts. Whether Multifamily, Single Family, Student Housing, Commercial, or Military, we simplify utility billing and expense management by doing it for you. Our insight into your utility consumption provides an opportunity to identify risks. Leveraging innovation and experience, we ignite solutions with real impacts and track performance to ensure the trendline stays laser-focused on the goal. To get there, we must build relationships within our organizations and outside of our organizations building the critical mass needed to truly make a difference. We have before us a tremendous opportunity. Standing shoulder to shoulder, we will get this done. Contact me at claughman@conservice.com for more information.
Follow us at:
Twitter: @BlogThirtynine

Instragram: ThirtyNine_Blog
