

Are you leveraging load factor in your energy efficiency assessments?
Are you leveraging load factor in your energy efficiency assessments?
The Stone Age did not end because we ran out of stones; we transitioned to better solutions. The same opportunity lies before us with energy efficiency and clean energy.... Steven Chu

Chances are, when you think of energy efficiency, your mind immediately jumps to LED Lights, HVAC Retrofits, and Building Controls such as programmable thermostats and sensors. Those are not wrong answers, but often overlooked is the impact of the load factor and the load profile of the property.

The load factor is an indication of how efficiently the property is using its energy. You might think of it like the gas mileage of your car. The more miles per gallon, the more efficiently you are using the fuel. Similarly, the higher the load factor, the more efficiently you are using the electricity.
For the utility supplier, a high load factor shows stability, and the property may be able to leverage this to qualify for lower rates or supply contracts. In fact, some suppliers will not contract supply for properties with a load factor below 40%.
Some utility providers will show the load factor on the bill, but if not, the information that allows for its calculation tends to be present. The formula is calculated by taking the total electricity used in a month (kWh), divided by your peak demand (kW) multiplied by the number of days in the billing cycle and the total hours in a day:

Let’s look at an example….
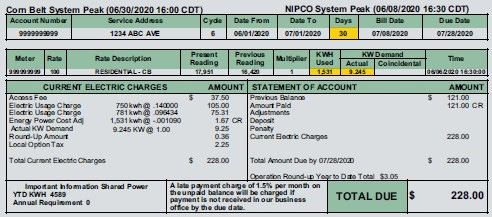
On this bill, we can see that the monthly energy usage was 1,531 kWh, the kW Peak demand for the month was 9.245, there are 30 days in this billing cycle, and of course, 24 hours in the day.

This combination of demand and consumption resulted in a bill of $228.
Now let’s take the same example, but in this case, the property was able to manage its demand usage, so it was using its electricity more efficiently over the course of the day.

We are not using less electricity; instead, we are using it more efficiently by staggering its usage throughout the day. This results in the load factor improving to 60% and the total electrical cost reduced to $222 (Sample source Iowa Lakes Electric Cooperative.)
You may be asking, then, how do I lower my load factor? One tool we can use to understand it better is the load profile. The load profile shows how a property’s energy use varies over time. The time period could vary; it may be over the day or a season. So let’s take a look at a load profile over a day:

We can see three different loads in the graph above. Across the horizontal line of the graph is the hour of use, and on the vertical line is the load (kWh). The green line is a pretty consistent use and likely the base load of the property. We can see that this load stays very close to 0.1 all day. But look at the other two loads, which vary from 0.3 to 1.2 in the case of the blue load, then drops before rising again in the late hours of the day. Similarly, we see the red line starting the day around 0.9 until mid-morning, then dropping until 4 pm, when it begins to rise again, leveling off back at 0.9.
At this point, we need to understand what the individual loads represent; perhaps three large chillers turn on at 7 am and run most of the day, but as they have overcome the heat load, they begin to back off in the afternoon, only to kick back on around 4 pm when people are coming back home the heat load begins to rise.
Knowing this, we might be able to stagger the start times and perhaps pre-cool at an earlier hour, potentially when the time of use rate may be reduced, if applicable. This may also be an opportunity to leverage solar energy to shave peak consumption as solar energy would be produced during daylight hours, potentially offsetting the times when usage rises due to the scheduling of this equipment.
Perhaps a decade ago, understanding demand charges might have only been a concern of large industrial and office properties. But increasingly, it has moved to residential, even impacting single-family homeowners. One tool that can provide your residents the ability to adjust with time of use charges and/or demand charges are the Nest or Ecobee Programmable Thermostats.
These thermostats have programs that allow the resident to opt into peak savings programs. Usually, this is provided through a time of use discount or incentive in which the residential user receives an economic incentive to participate in peak energy use events. Remember that peak on the graph above, which rose in the late afternoon. This corresponds with people arriving home from work, turning on their air conditioners, and solar energy production reducing. Utilities predicting when peak demand may occur can control the thermostats of residents who have agreed to participate. The utility company sends a signal for a program to pre-cool the residence before the event and then increases the set point to reduce the need for cooling during the hours of the peak shaving event. In theory, the pre-cooling should allow the resident to “ride out” the event without requiring additional cooling during the event hours. In return, the resident receives a utility credit to compensate them for participation.
The resident can also leverage the programming function to pre-cool when rates are lower. Hint - in both examples of what the resident can do - you can also typically do in your common areas as well using the same tools and programs.
You may be asking why - why all of this emphasis on the timing of energy, but let’s look at how our electric grid responds to demand for electrical capacity. Our grid has attached backup electrical generation called peaker plants. As the name indicates, these plants are only used during peak demand periods. When the energy use exceeds what is provided through the utility supplier’s expected capacity generation, they turn to these “peaker plants” to provide the additional load to prevent brownouts or blackouts. Kind of like dropping your car into low gear when you suddenly encounter conditions that your normal gear load cannot effectively handle. But just like when you shift into those lower gears, there is a consequence with the performance of your car; the peaker plants are also less efficient. There is also a dirty secret with peaker plants; they have to generate power on demand, with little notice regardless of sun or wind; to do this, they use fossil fuels to generate the additional power needed to prevent brownouts or blackouts. Often these are natural gas, but may even be oil-fired electrical generation plants. Peaker plants typically use fuel sources that are more polluting and are also less efficient and expensive to operate.
Ever drive on a toll road and notice that the gas prices tend to be more expensive at those gas stations compared to those not on the toll road? They are taking advantage of those drivers who may not have planned ahead and now need fuel and with increased need comes increased willingness to pay higher rates. The same is true for these peaker plants. Often these are privately owned plants that exist for one reason and one reason only - to provide electricity when the power company has run out of fuel unexpectantly. As such, the peaker plant charges similarly to that toll road gas station - taking advantage of the utility companies’ lack of planning for the required load.
One report has found that in New York City, over the last decade, utilities have paid more than $4.5 billion to the private owners of the city’s peaker plants just to keep those plants online in case they’re needed — even though they only operate between 90 and 500 hours a year. Even at the upper limit, that’s less than three weeks. This all means that the price tag for peak electricity in the Big Apple is 1300 percent higher than the state’s average electricity cost. These fees, of course, are passed on to the end users, but you can see why utilities are trying to control the electricity demand.
The built environment further contributes to this issue as we move away from Scope 1 emissions and electrify our properties. While it is good to eliminate the need for on-site fossil fuel consumption, this shift does require increased electrical production. Pair with the increasing numbers of electric vehicles, increased cell phone market saturation, and other wireless devices increasing - the bottom line is despite an increased focus on energy efficiency, the electricity demand is steadily increasing, with the demand forecast to continue to increase through 2024 at a rate of 2.7% a year on average.
Utility companies are in a difficult position, they don’t want brownouts or blackouts, and they don’t want to use expensive peaker plant-supplied electricity. The tool they often turn to is demand charges or time of use charges. If their consumers are not able to use their electricity in a predictable and efficient way, they are using the stick approach to encourage them to do so. As owners or managers of properties in the built environment, understanding what is behind these charges begins to help us figure out how to deploy strategies to address the circumstances behind them. This may have been previously only an issue for industrial properties or office buildings, but increasingly it is important for every property to understand it - even single-family residential. It is yet another factor in understanding what is happening in your portfolio and where opportunities may be present to decrease energy consumption.
You can help reduce the built environment’s impact by sharing this blog with your peers. Together we can impact the 39% of greenhouse gasses attributed to the built environment. It starts with awareness, and we succeed with teamwork.
Stay well!
Chris Laughman is the ThirtyNine Blog author, a blog dedicated to reducing the impact of the built environment. When not blogging, Chris is helping residents, clients, and investors reduce their energy, carbon, waste, and water impact as the Senior Director of Energy and Sustainability for Greystar. Our team’s insight into the utility consumption of our managed and owned portfolios provides insight into opportunities to identify and mitigate risk. We leverage innovation and experience to ignite solutions with real impacts while tracking performance, ensuring the trendline stays laser-focused on the goal. We in real estate have a tremendous opportunity to make a difference in the built environment. Standing shoulder to shoulder, we will get this done. I can be contacted at: chris.laughman@greystar.com for questions, concerns, or collaboration.
The opinions expressed in this blog are my own.
Follow us at:
Twitter: @BlogThirtynine

Instagram: ThirtyNine_Blog
