

6 Steps to get more Bang for your Buck
6 Steps to get more Bang for your Buck
Leveraging Benchmarking Data for more Impactful Portfolio Decisions


When looking across a dozen properties or a thousand properties, understanding what locations offer the best return on investment can be challenging at best. Investing time and cash at one location can have significant differences in utility consumption reduction compared to spending the same effort and dollars at another location. The key is knowing where to look, having a compass to guide you.
Benchmarking provides such a tool. For those unfamiliar, benchmarking is comparing your performance against a standard. There are two keys to that definition. In order to compare you must have data. If you don’t understand your own performance, it is impossible to compare your performance against anything else. The other key is the standard itself, how robust is the standard that your comparing against. If your only comparing against your own performance, you may have no indication if your performance is actually good. A poorly performing property, performing poorly year over year may not reveal itself when only being compared against itself or against budget.
To understand benchmarking, lets break it down into the 6 steps that make up benchmarking:
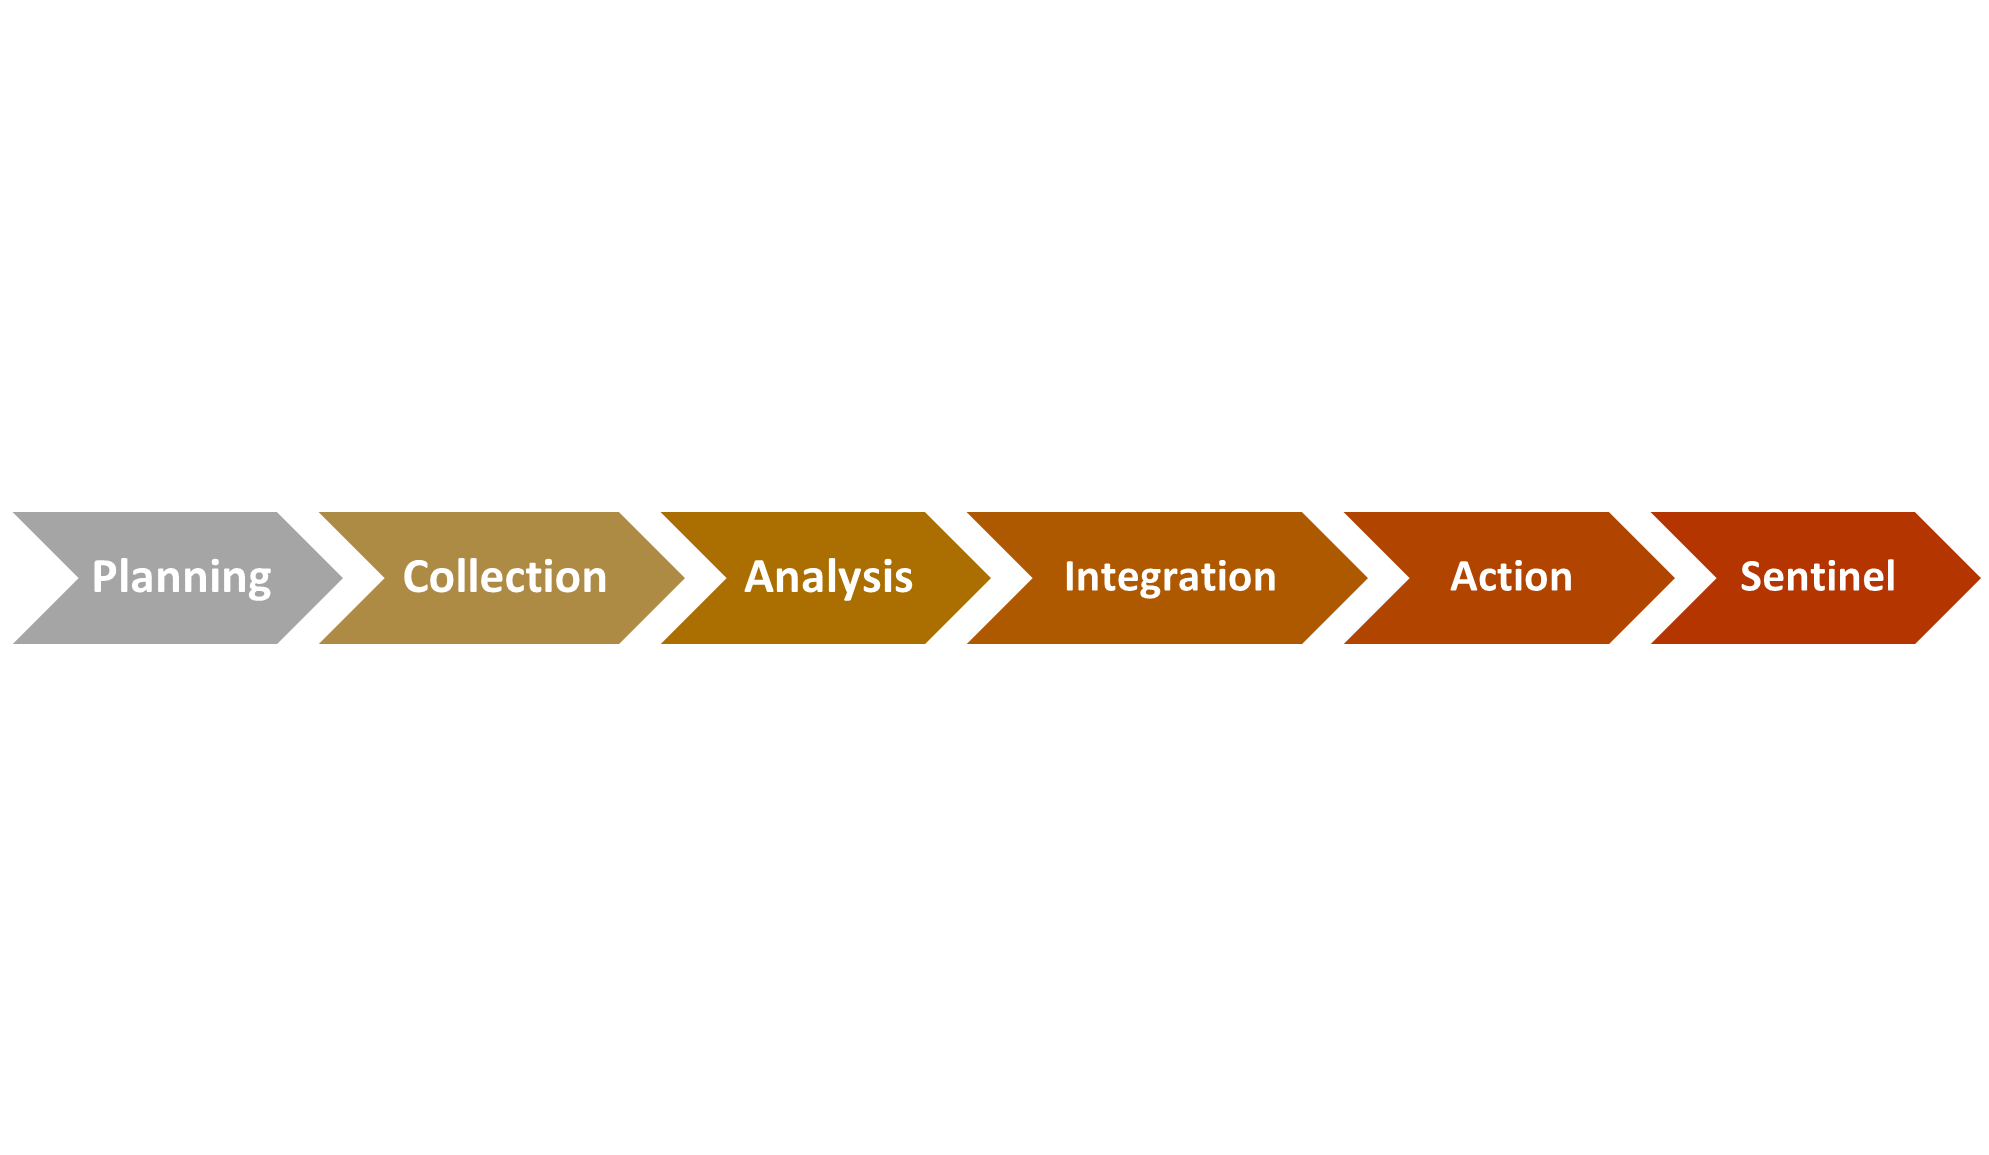
1. Planning Phase
We should measure what is meaningful, while this will vary according to your own organization’s goals there are some standards when it comes to ESG reporting that can be leveraged. Most external reporting schemes will evaluate consumption in terms of energy the property uses. Ideally this is whole building data, with the ability to isolate and identify what consumption is tenant controlled and what data is owner controlled.
In addition to understanding what should be collected, you also need to determine what to compare the data against and how large of a data sampling is included in that comparison. In the multi-family world, we often turn to EnergyStar portfolio manager for a comparison group. What is often not realized in using this standard is the actual data set that EnergyStar uses for this comparison. When comparing multi-family data used by EnergyStar, it is a much smaller data set then other property types such as commercial or industrial. The same analysis should be examined when looking at third party benchmarking tools. The question should be asked, how many multi-family buildings are in the comparison data? What building types are included in the comparison data? What climate zones are included in the data? Are you able to compare my property against other properties that are of similar type and location? For example, a garden style property will not provide a good comparison against a high rise. A property located on a coast in a sub-tropical region will not compare well against a property located in a more continental, or northern zone.
Collection Phase
The second phase in benchmarking is the collection of the data. This is particularly challenging in multi-family due to separate tenant and owner controlled areas. I will go into more detail next week when we cover data coverage, but for purposes of this article determining how you will collect the data is an important step and one not to overlook for a successful benchmarking analysis.
This data collection should include both dollars cost as well as the unit and amount of the actual consumption, i.e. kW of electricity used. This can be captured through utility bill collection and analysis, but may also be collected through meters or building specific systems such as building automation systems. In general, the fresher the data, the more actionable the data will be.
Analysis Phase
Assuming that you spent adequate time in the planning phase on the question of who you will compare against and how this comparison will take place, this phase is where the actual comparison occurs. The key finding here will be understanding your strengths and your weaknesses, how do you stack up.
It is important to understand that this analysis is deeper then simply comparing two data sets. A strong analysis will include evaluating the root causes for the differences. Is your property performing better or worse? Why? What is driving that performance? What specific characteristics can we learn from the data and how can we apply that to manage our performance?
Integration Phase
Now that we understand how our property is performing against like properties, what are we going to do with that data? If it sets on a spreadsheet and is not leveraged to manage the performance of the property, we have likely just spent a lot of effort and expense for no reason. The data must drive action.
Internally the data should be used to develop a hierarchy of needs. What locations are performing at what level and what is the cost of that performance in terms of economic and environmental impact. An extremely poorly performing property that only spends $100 annually in energy costs and only consumes 1000 kW may not be the best focus compared to a average performing property that spends $100,000 annually in energy costs and consumes 1,000,000 kW. This is the bang for the buck evaluation.
This same integration phase is also where budgets are set, presentations are developed and senior management is presented with a plan to incorporate the benchmarking data into a performance plan. Strategies are developed and action plans are drawn up.
Action Phase
This is where the rubber meets the road, energy efficiency measures and water efficiency projects are contracted and completed. Waste reduction strategies are put in motion. The plan that was identified through the first 4 phases now results in actions to intervene in the properties performance.
The strength of your organizations procurement processes come to light during this phase. Your ability to identify partners who can execute the plan is key as is the ability to identify incentives and rebates to help offset the expense of implementation.
Sentinel Phase
The work is not complete once the plan has been implemented. An equally important element is watching over the performance going forward. Leveraging the same process that was used to initially benchmark the performance, it is equally important to continue to follow the performance post-implementation. This not only provides verification of the effectiveness of the integration and implementation but also provides insight into future performance issues providing the property with the ability to proactively manage maintenance and utility performance.
One way to think of this is to bring these 6 distinct phases into a more simple model of Find - Fix - Follow. The first three phases are part of the Find, while the Fix includes the next two and the final phase is the Follow. This allows our clients a turnkey process for total energy and water efficiency strategy.

In the grand scheme, this process results in reduced operational expense and just as importantly it provides a mechanism to evaluate property performance across an entire portfolio. If you have made commitments to reduce carbon, energy, water, or waste - this is the tool to reach those goals. This process becomes a key performance indicator that can be used to identify the operational management of the assets, and a differentiator.
You can help reduce the impact of the built environment by sharing this blog with your peers. Together we can impact the 39% of greenhouse gasses attributed to the built environment. It starts with awareness, and we succeed with teamwork.
Stay well!
Chris Laughman is the ThirtyNine Blog author, a blog dedicated to reducing the impact of the built environment. When not blogging, Chris is helping the real estate industry reduce energy and water impact as the Vice President of Sustainability for Conservice, the Utility Experts. Whether Multifamily, Single Family, Student Housing, Commercial, or Military, we simplify utility billing and expense management by doing it for you. Our insight into your utility consumption provides an opportunity to identify risks. Leveraging innovation and experience we ignite solutions with real impacts and track performance to ensure the trendline stays laser-focused on the goal. At Conservice we have developed a true bill-to-boardroom solution to help truly make a difference. We have before us a tremendous opportunity. Standing shoulder to shoulder, we will get this done. Contact me at claughman@conservice.com for more information.
Follow us at:
Twitter: @BlogThirtynine

Instagram: ThirtyNine_Blog
