

3 Obstacles to Data Driven Decisions
3 Obstacles to Data Driven Decisions
The challenge of data and developing a more strategic approach

Listening to Dr. Deborah Birx being interviewed on the US response to the Covid Pandemic this morning was a bit sobering. As we approach 1,000,000 Covid-19 deaths, her statement that had we just followed the data and acted on the data instead of politicizing the response, she estimates 30% - 300,000 lives - could have been saved. That is a staggering comment, the population of Pittsburgh is 316,718 and Cincinnati 308,728. Grandfathers, Grandmothers, friends, and neighbors.
If we had just followed the data…
The same could be said for climate science. As early as 1912, Popular Mechanics posted an article entitled “Remarkable Weather of 1911: The Effect of the Combustion of Coal on the Climate - What Scientists Predict for the Future.”

For over a century, data has been presented, and data has been ignored, the data presented was not acted on. So why do we ignore data? Do we intentionally ignore it? While that may be true in some cases, I would propose that perhaps it is not the data itself that is the issue, but perhaps the message accompanying it.
This brings us to the first obstacle in acting on data; there needs to be a “me” element in the presentation. How does this affect me? Immediate concerns trump eventual concerns, and without a call to action, we may not consider the consequences of taking actions important enough to act. In fact, the further in the future the perceived risk, the more likely we are to discount acting on the risk.
The second obstacle is acting on what is urgent instead of important. Many of us are just trying to get through the inbox or just trying to get through the day. We find ourselves firefighting, leading to incomplete solutions, reoccurring or cascading problems, and many of our problems turn into crises. Acting on what is urgent instead of what is important is a downward spiral that causes stress for the employee and can cause the overall company performance to drop.
The third obstacle is on display in nearly every natural disaster or other forecasted event, optimism bias. This is the attitude of, “I know this may impact other people, but it won’t impact me.” It also often results in visuals of people being rescued off of roofs during flooding as they didn’t believe it would actually be as bad as they said it would be.
Now let’s take these three obstacles and apply them to energy or water conservation. How often is the data right in front of us, but we don’t act on it? We might not be acting on it because we don’t understand what the data is saying. In that case, data visualization and efficiency consultants can likely help you understand what the data is saying.
If we understand what the data tells us, how are we framing our ask for action on that data? Are we pointing out what is in it for asset management, operations, or accounting? Reducing operational expenses improves profitability and can also help ensure the capital assets reach their expected life. Identifying inefficiency can also mitigate risk both in terms of regulatory risk and, potentially, insurance costs. While it is nice to say we are doing it because it is the right thing to do, the right thing to do benefits the triple bottom line as well.
Consider implementing a formal data management plan to move from a tactical approach to a more strategic approach to data. When we think about why we might need to be a bit more formal in our approach to real estate data, the reason behind it is pretty simple - it is complex. Many factors go into decisions about real estate, as well as utility efficiency in real estate.
An example I picked up at a conference some time ago was the analogy of crossing a street. When we step to the curb, we take in data to determine if we can cross or not. We are observing the traffic, the weather, other pedestrians, etc. The simplicity of this problem allows us to use intuition to decide our course of action. Unlike crossing the street, real estate brings in multiple factors. From split incentives to meter configurations and many more factors, the data is messy and requires a process.
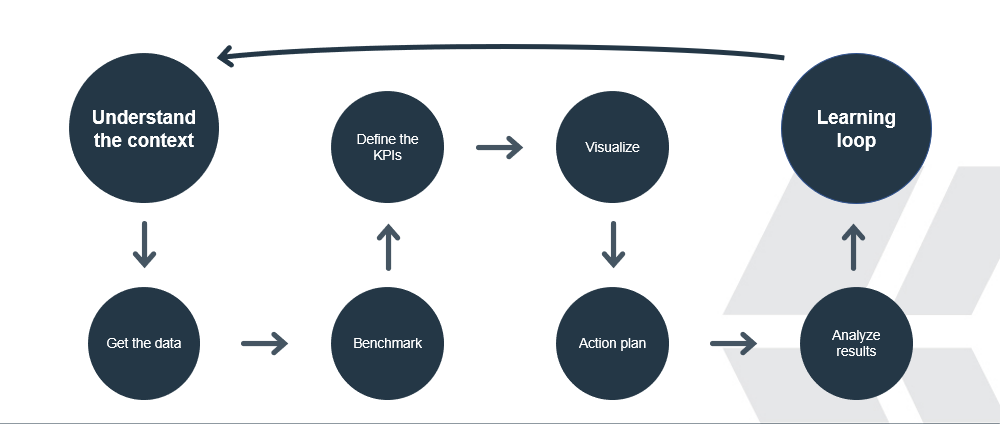
The first step of that process is understanding the context, or in other words, what is the issue we are trying to solve.
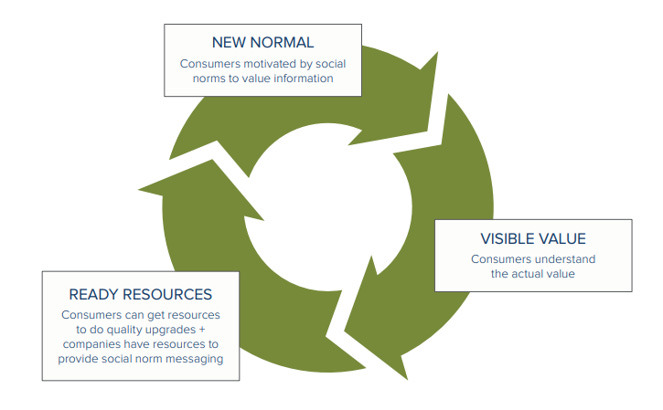
We are being confronted with a new normal, consisting of consumers being motivated by social norms to value information. This is combined with data that suggests that consumers also have an increased focus on environmental impacts. According to the National Association of Realtors 2017 Sustainability Report, 56 percent of survey respondents find that clients are interested in sustainability, and 71 percent said that energy efficiency promotion in listings was very or somewhat valuable.
It is critical to recognize that our prospective residents or tenants are motivated by information and interested in sustainability, they are becoming more knowledgeable and understand the value of information. Ask a Generation Z’er and even a few millennials or Gen X’ers what they want to eat for dinner. Chances are, they will pull out their smartphone and start researching. This behavior is telling in that they are seeking information to base a buying decision.
In the utility sector, service providers have been leveraging energy performance data to educate utility customers, encouraging them to reduce energy consumption and promoting value on energy. Those real estate owners that can draw on this link between energy performance and value will be positioned to engage prospective residents, feeding into their adopted social norm that high energy performance is the “new normal” and realizing the value that is provided by engaging residential living decisions in an organization that emphasizes energy efficiency. The resulting positive cycle produces an environment where consumers attribute greater importance to energy performance and are more motivated to reside in communities that mirror their values.
Once you understand the context, the next step in the process is determining where the data comes from. The advantage we have is that most buildings have energy meters that record actual energy usage in the US. Still, it is essential to note that people use buildings differently, and utilities rarely share this data publicly. This requires us to think about how we best obtain that data, which starts at the meter.
Especially in residential real estate, the process of requiring tenants to place the utilities in their name and contract with each turn poses some challenges to owners that we need to think about. For starters, it costs our prospective residents additional money and causes complications with each move-in. They have to contact utility companies to arrange for service activation, potentially have deposits, and are forced to navigate the utility company processes. Every new activation is another activation fee, and a new account has to be generated, etc.
From a data perspective, when the utility consumption goes into the tenant’s name, the owner no longer has information concerning the utility consumption of the property. We need data for benchmarking, tracking, potentially identifying issues or opportunities, and reporting.
From a risk standpoint, this was previously viewed as shifting the risk of non-payment to the tenant. However, we already have a much larger monthly bill that we are holding the tenant accountable for, the monthly rent. Are we truly shifting risk by moving the utility in and out of the tenant’s name with each turn?
Further complicating this are the SEC proposed climate disclosure rules. A cornerstone of SEC rules has been the disclosure of information that is material to investors so that an informed purchasing or selling decision can be made. The Form 10-K is the vehicle that this disclosure is made on, an annual disclosure filed 90 days after the company’s fiscal year. However, utility data trails 30, sometimes 45 days after the consumption period. This delay in getting data, analyzing it, and disclosing it per the SEC proposed climate disclosure rules presents a risk for publicly filing entities. This risk is reduced if the filing entity has access to the bills as soon as they are available.
That scenario is if the bill is in the owner's name, but what if we do not have direct access to the utility accounts due to the setup of the accounts, i.e., placing them in the tenant's name, then we are reliant on the utility company to provide aggregate data. In some cases, these aggregate data requests are only provided once a year (if at all). Often, that annual share is around the time of benchmark reporting ordinances, which generally run from April to June. 90-180 days after the end of the physical year if the company runs on a physical year.
As you can see, getting data is messy, but once you have it, you need to analyze it. Comparing it against peers and against history to determine how the property compares. Basically, you are trying to figure out just what is normal and how does the property compare to normal. The more extensive the portfolio, the more critical this comparison is.
The next stop in this formal data process is setting KPIs. Tangible, Specific, and Relevant KPIs that find the right performance indicators you are trying to address.
The only issue with all of these KPIs and Benchmarking is we just took data that is already messy and made it more chaotic. While you can use excel on a small number of properties, you quickly will have data going in multiple directions, making it harder to make sense of it. This is where the next step in a formal data management process steps in, which is data visualization. It’s easier to catch the trends and anomalies when we have our data on a dashboard. Let’s put the performance data for leading and lagging indicators on the same chart!
Many dashboards provide visualization, but the visualization must be contextual enough to make a difference for decision-makers. When visualization can lead to decisions, it moves your data one step closer to actionable data. If an engineering degree is required to understand the dashboard, it is not actionable.
With your data in a more usable form now, we can finally take action on it. This is where the tactical, property-level measures can be taken to impact inefficiency. Action plans can be developed to describe the type of decisions and specific activities, the rationale behind why it makes sense, and the time and budget needed for the impact.
Once the action is taken, it’s time to prove the result. Although those are essential elements, this is more than just ROI and payback. Analyze reasons for failure or success and look for opportunities to improve the process. What principles were helpful? What approaches need to be improved? Look for returning problems, remove unnecessary complexities, and update templates and standards.
Then rinse and repeat…
You can help reduce the impact of the built environment by sharing this blog with your peers. Together we can impact the 39% of greenhouse gasses attributed to the built environment. It starts with awareness, and we succeed with teamwork.
Stay well!

Chris Laughman is the ThirtyNine Blog author, a blog dedicated to reducing the impact of the built environment. When not blogging, Chris is helping the real estate industry reduce energy and water impact as the Vice President of Sustainability for Conservice, the Utility Experts. Whether Multifamily, Single Family, Student Housing, Commercial, or Military, we simplify utility billing and expense management by doing it for you. Our insight into your utility consumption provides an opportunity to identify risks. Leveraging innovation and experience, we ignite solutions with real impacts and track performance to ensure the trendline stays laser-focused on the goal. At Conservice, we have developed a true bill-to-boardroom solution to help truly make a difference. We have before us a tremendous opportunity. Standing shoulder to shoulder, we will get this done. Contact me at claughman@conservice.com for more information.
Follow us at:
Twitter: @BlogThirtynine

Instagram: ThirtyNine_Blog
